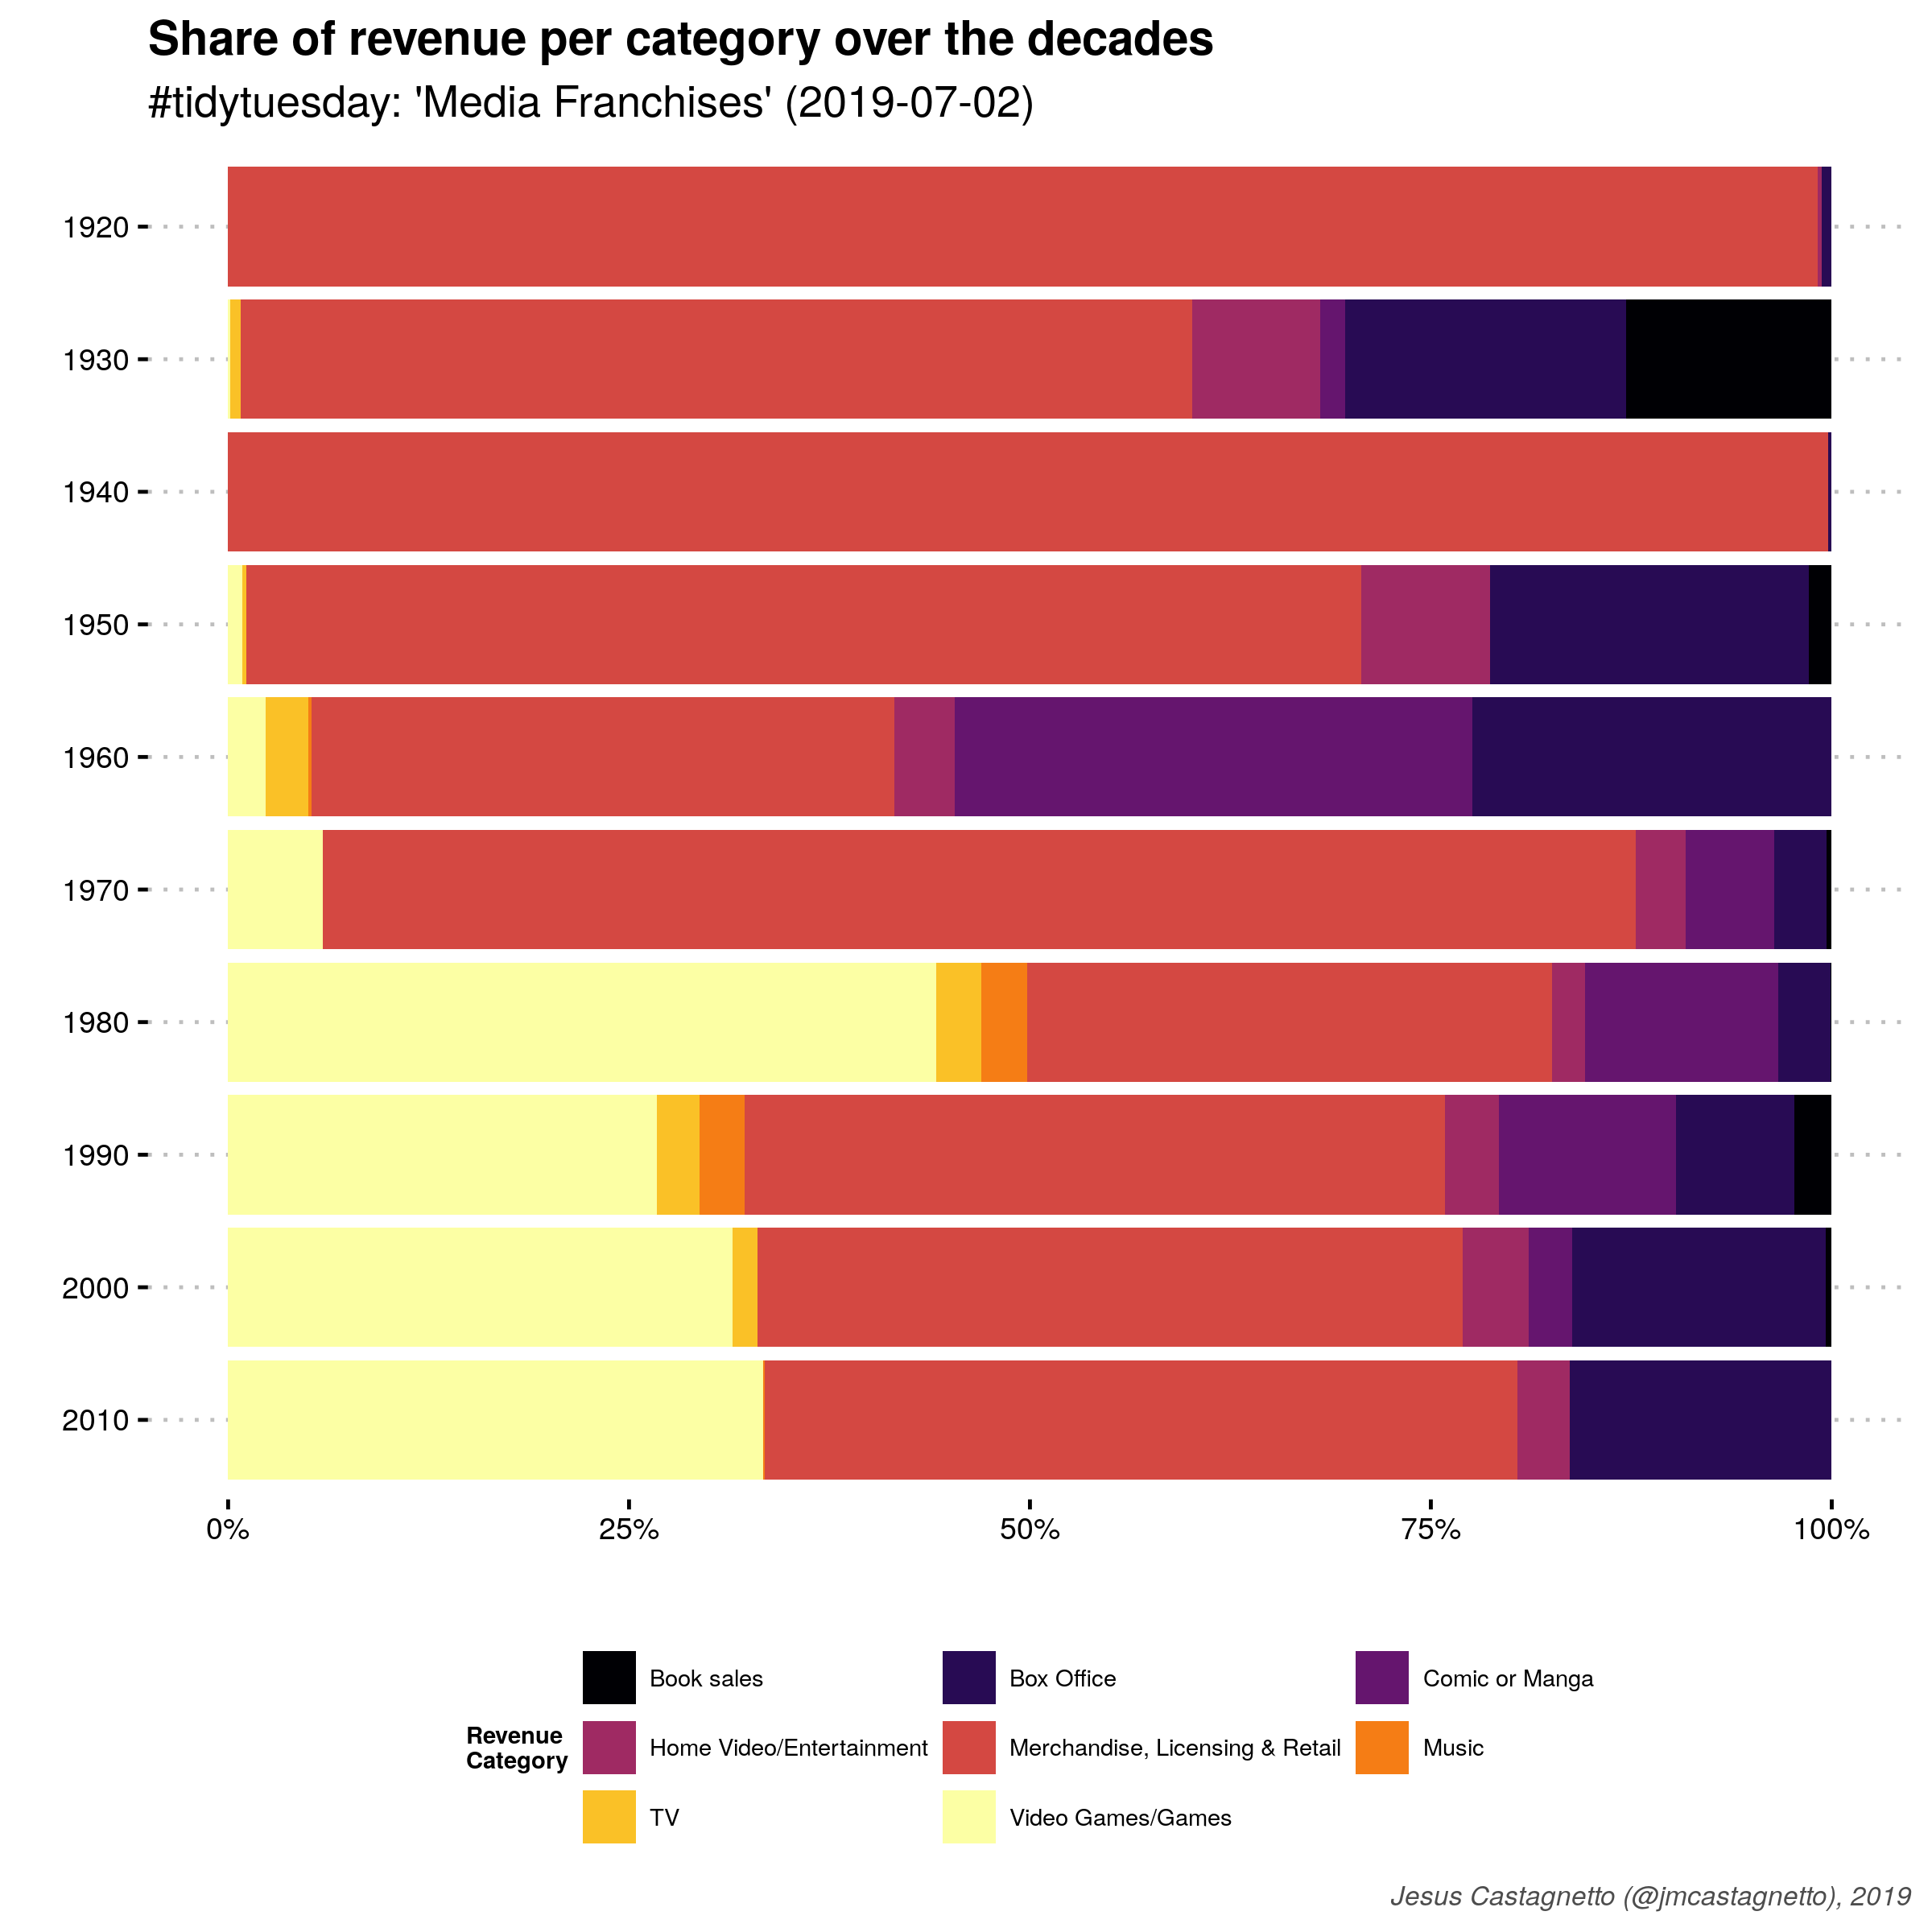
Looking at revenue in the 'Media Franchises' dataset
by Jesus M. Castagnetto
Share of revenue per category over the decades. Source code
An animated radar chart using gganimate and ggiraphExtra
Categories: tidytuesday - R
by Jesus M. Castagnetto
Share of revenue per category over the decades. Source code
An animated radar chart using gganimate and ggiraphExtra