Exploring the Video games dataset
by Jesus M. Castagnetto
The data comes from #TidyTuesday Video games dataset, and I decided to go “old school” and used the txtplot R package.
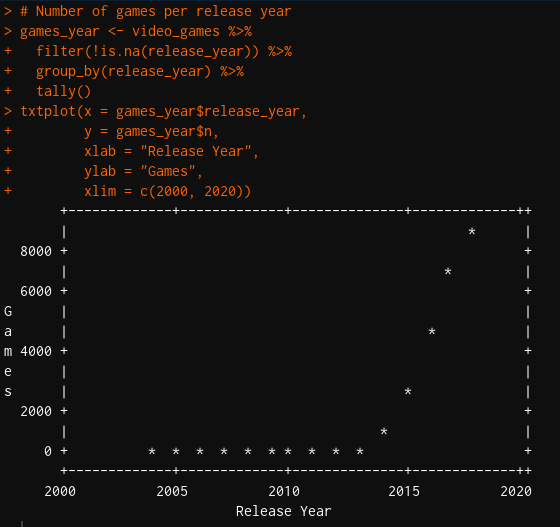
First, let’s graph the number of games released per year
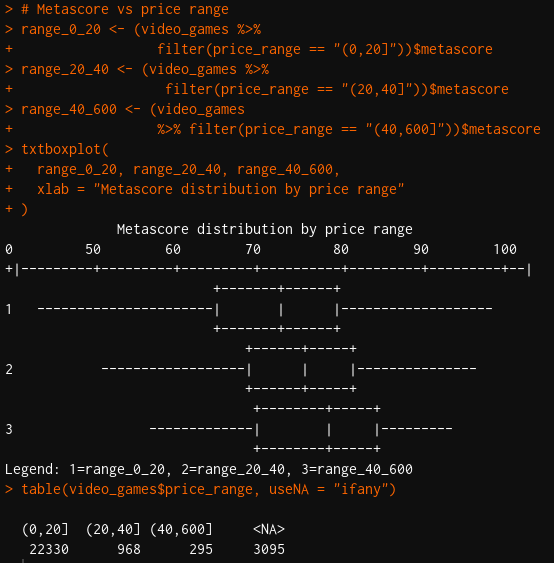
Next, we can plot their Metascore distribution by price range:
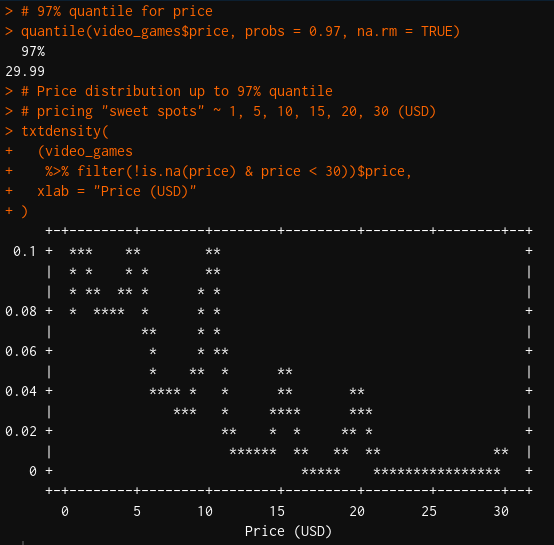
Finally, we will plot the price distribution, to find the pricing “sweet spots”:
As an added bonus, here is an animation of how game ownership has changed over the years, classified by price range:
Categories: tidytuesday - R