Analysing Bob Ross paintings
by Jesus M. Castagnetto
The data comes from the #TidyTuesday dataset on Bob Ross paintings.
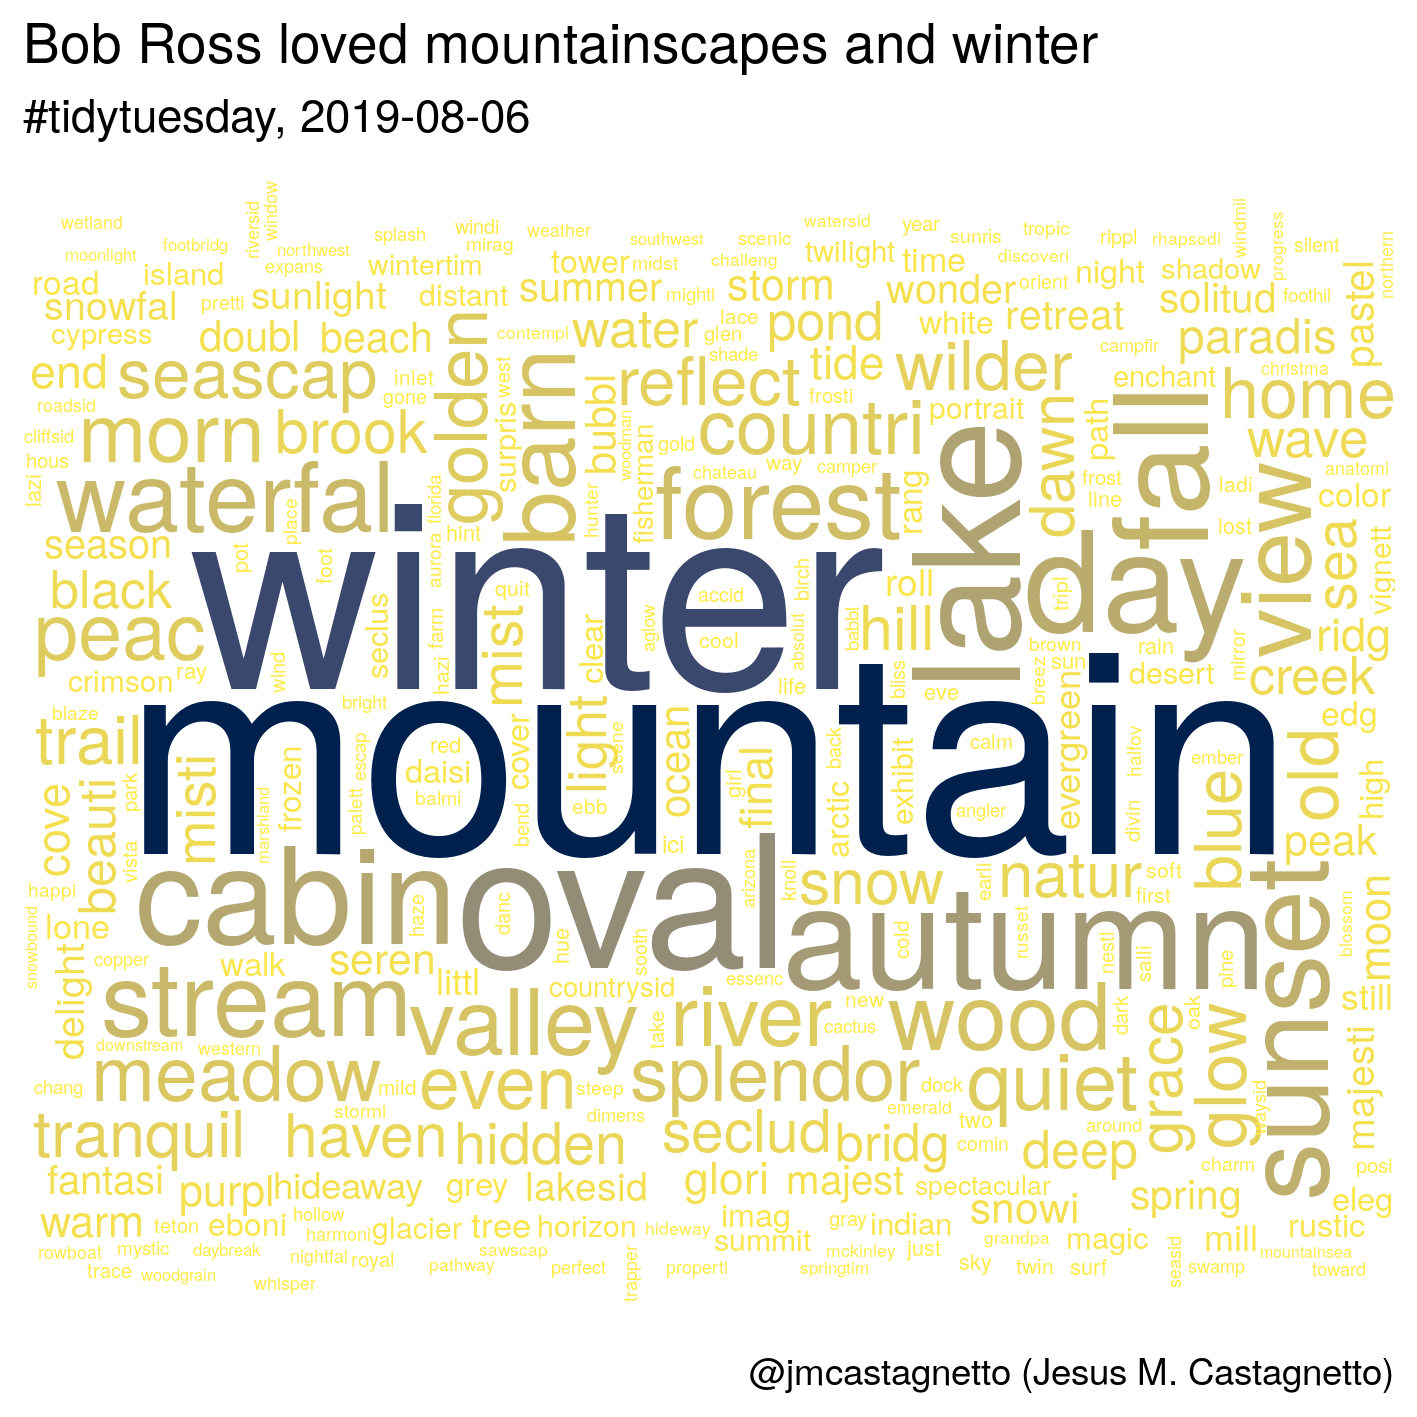
First, a word cloud of the most frequently used themes/items in the paintings:
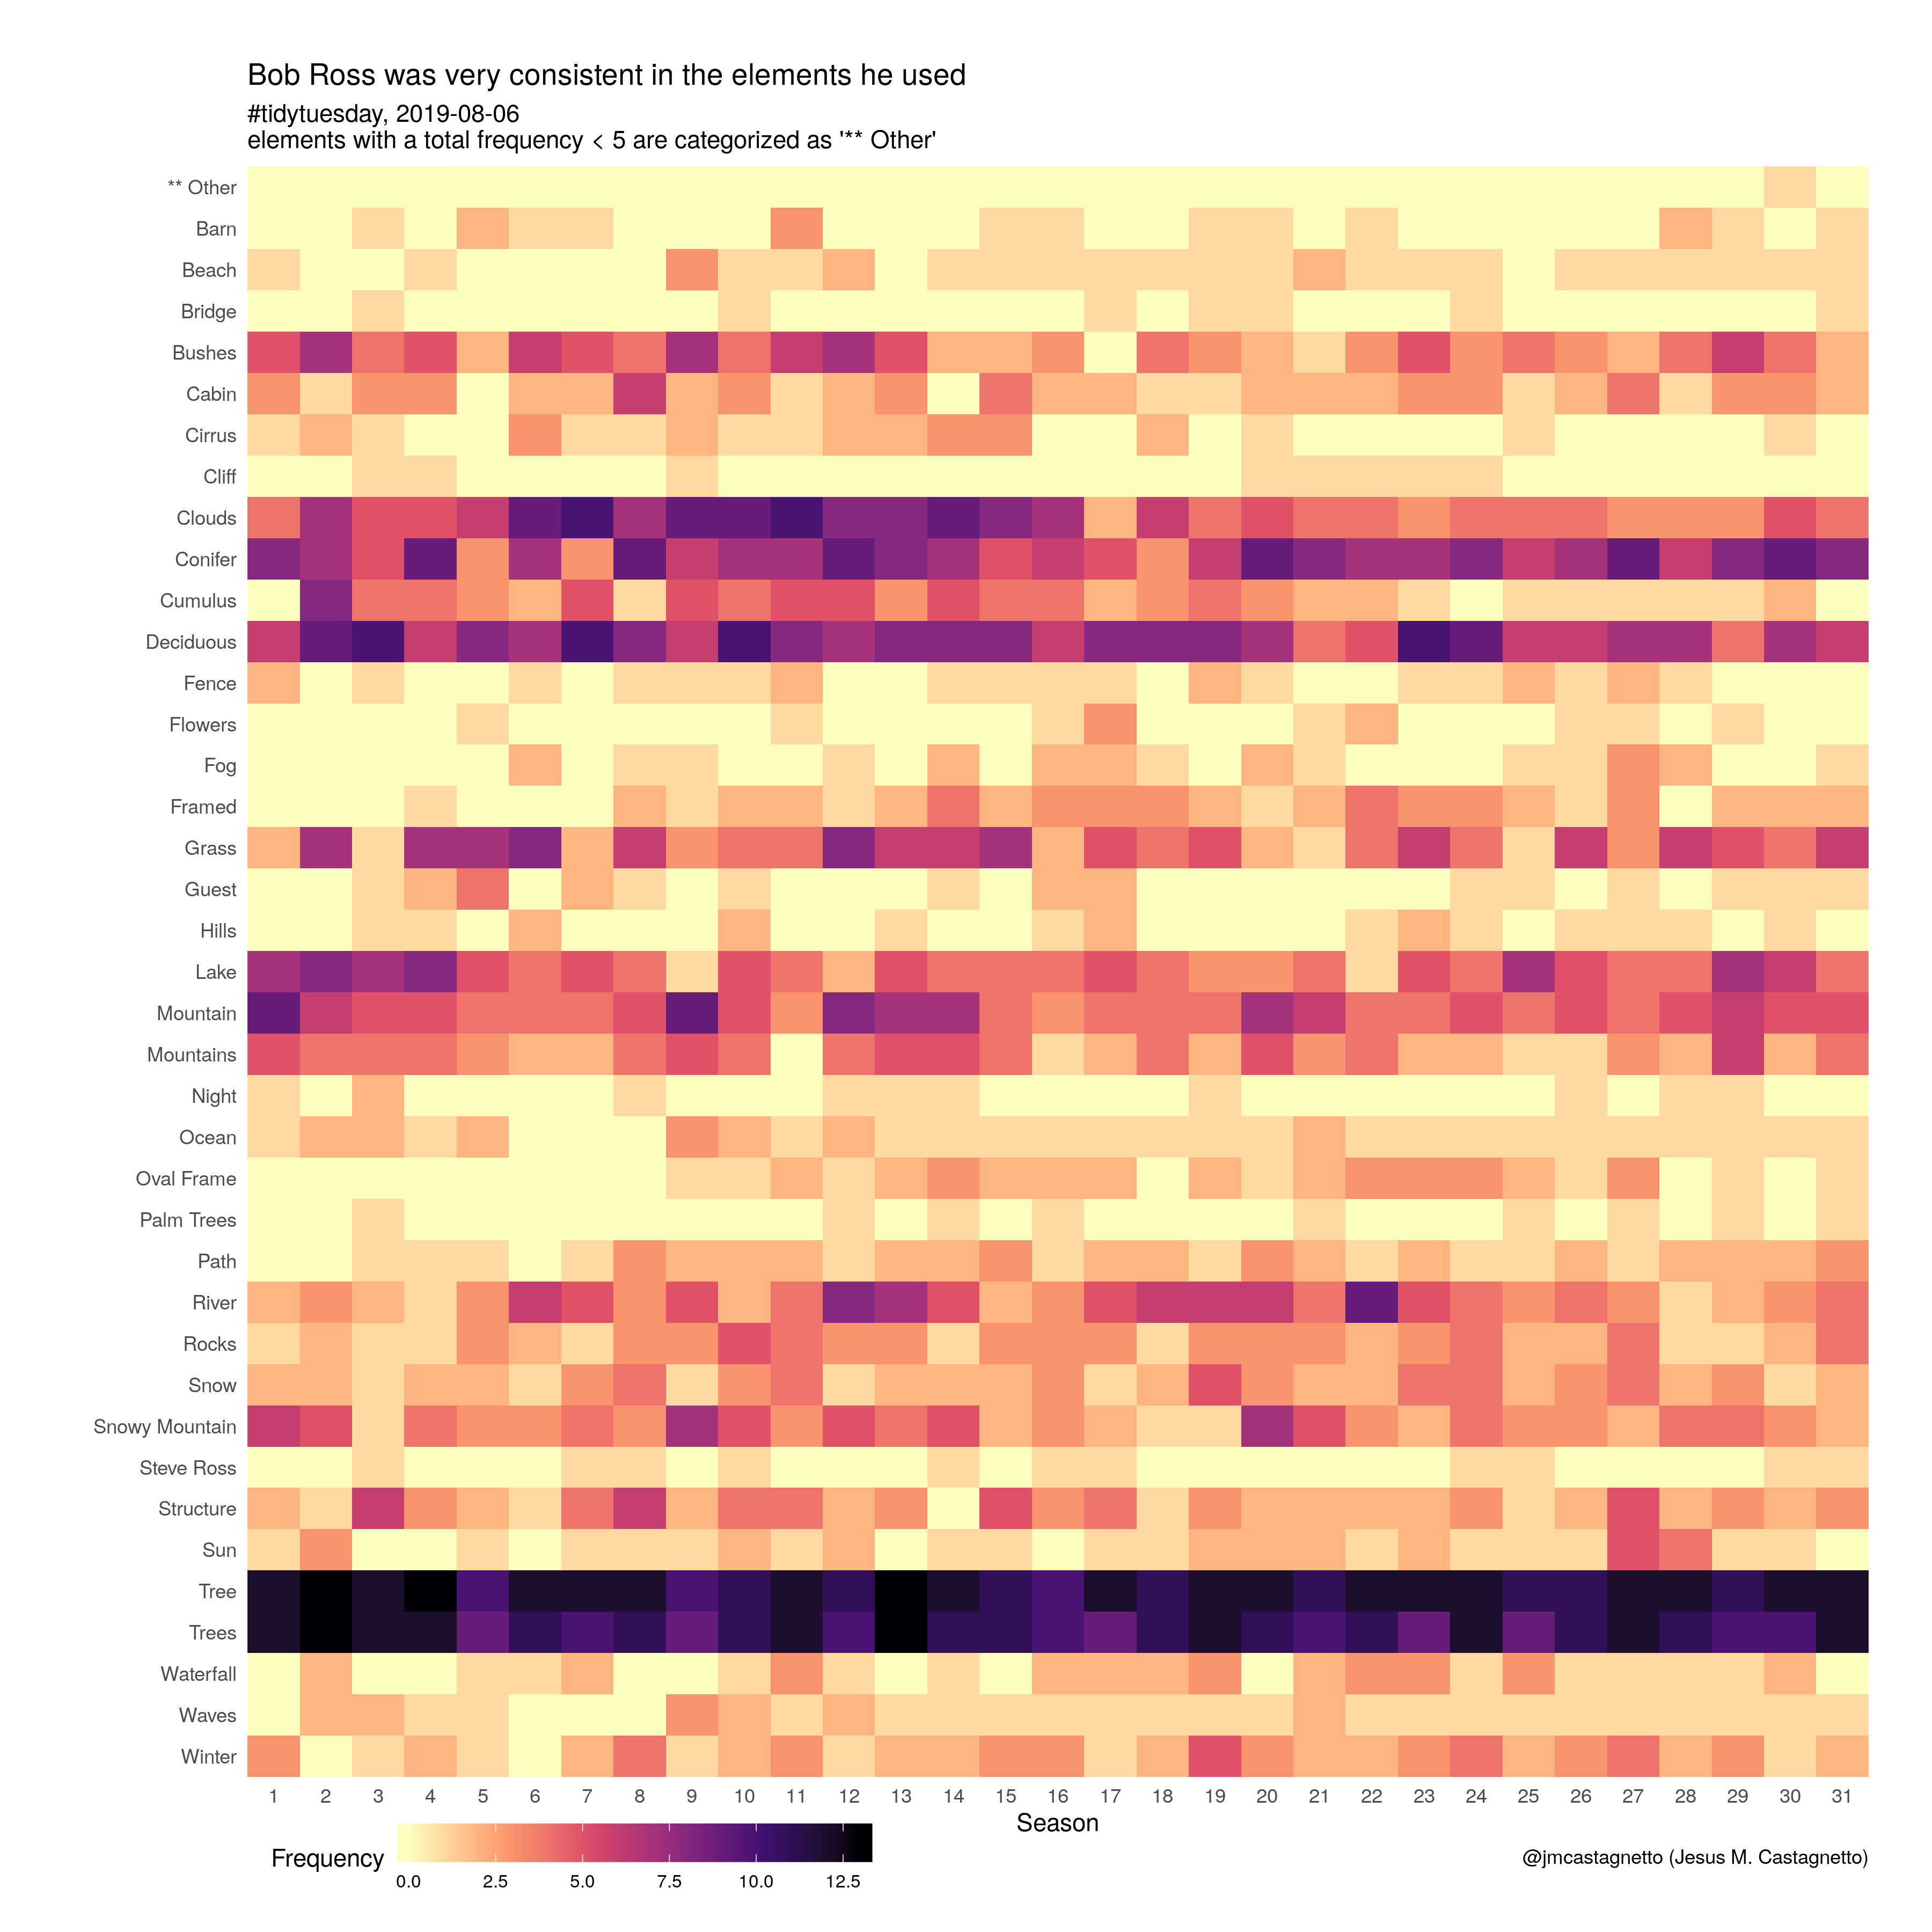
Next, we can see a heatmap showing his use of these elements accross the seasons:
Finally, we will do a (hopefully) artistic looking circular barchart of the element’s frequencies:
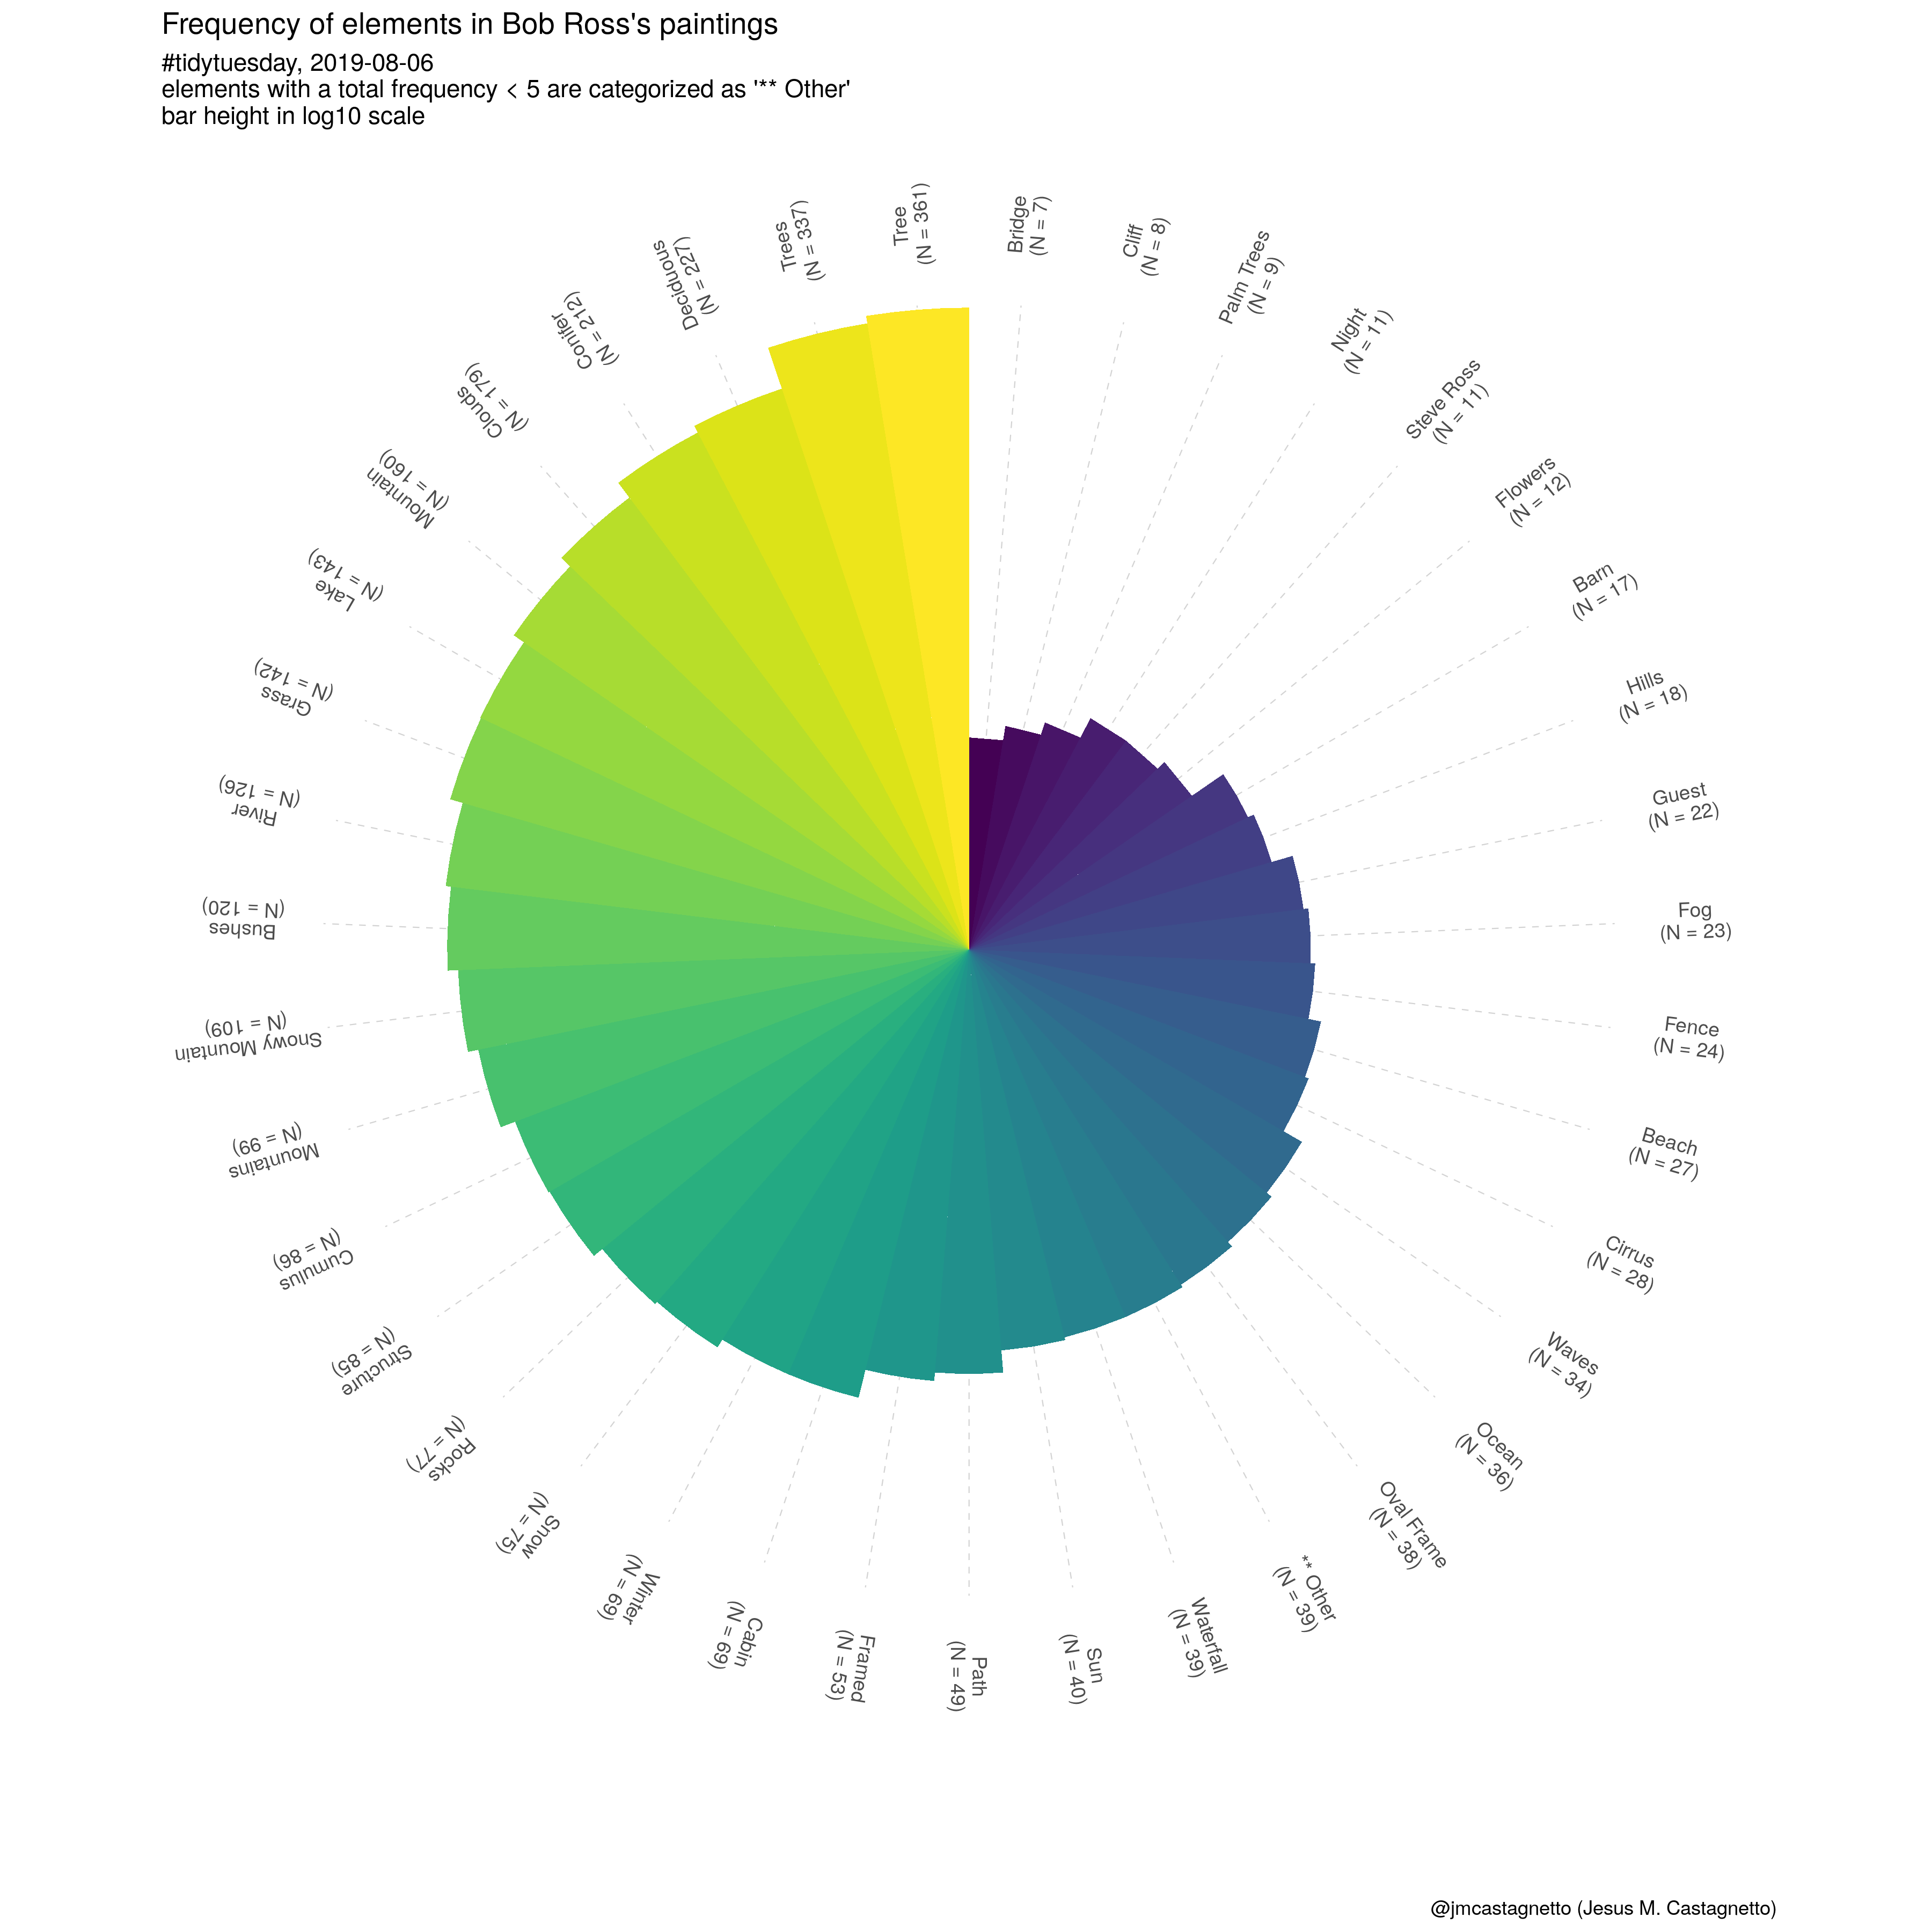
Sort-of, kind-of, looks like a painter’s palette ![]()
Categories: tidytuesday - R