Interactive graph of roman emperors
by Jesus M. Castagnetto
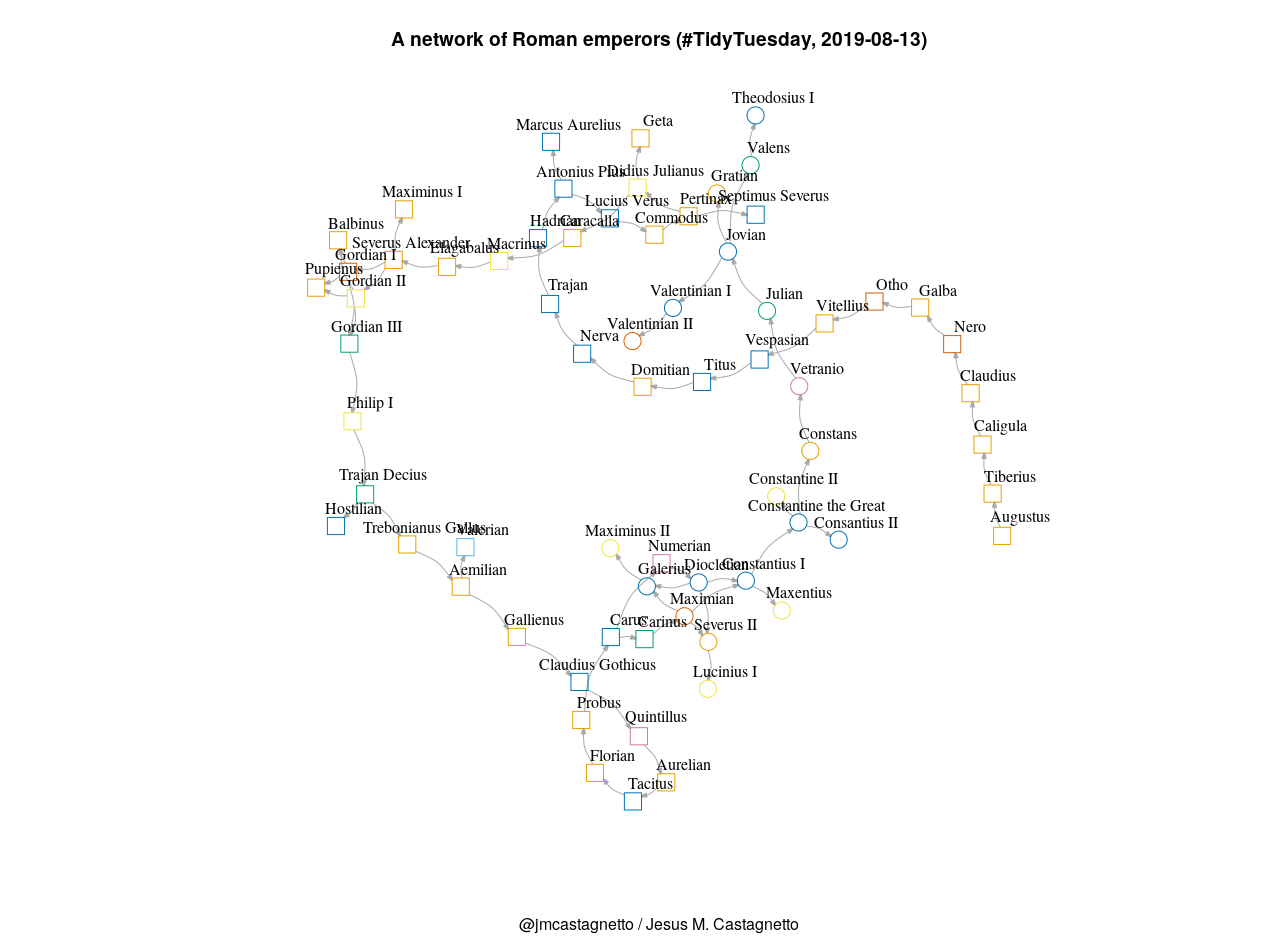
Using visNetwork
Emperors from the Principate era marked as squares, and from the Dominate era as triangles.
An interactive graph using visNetwork.
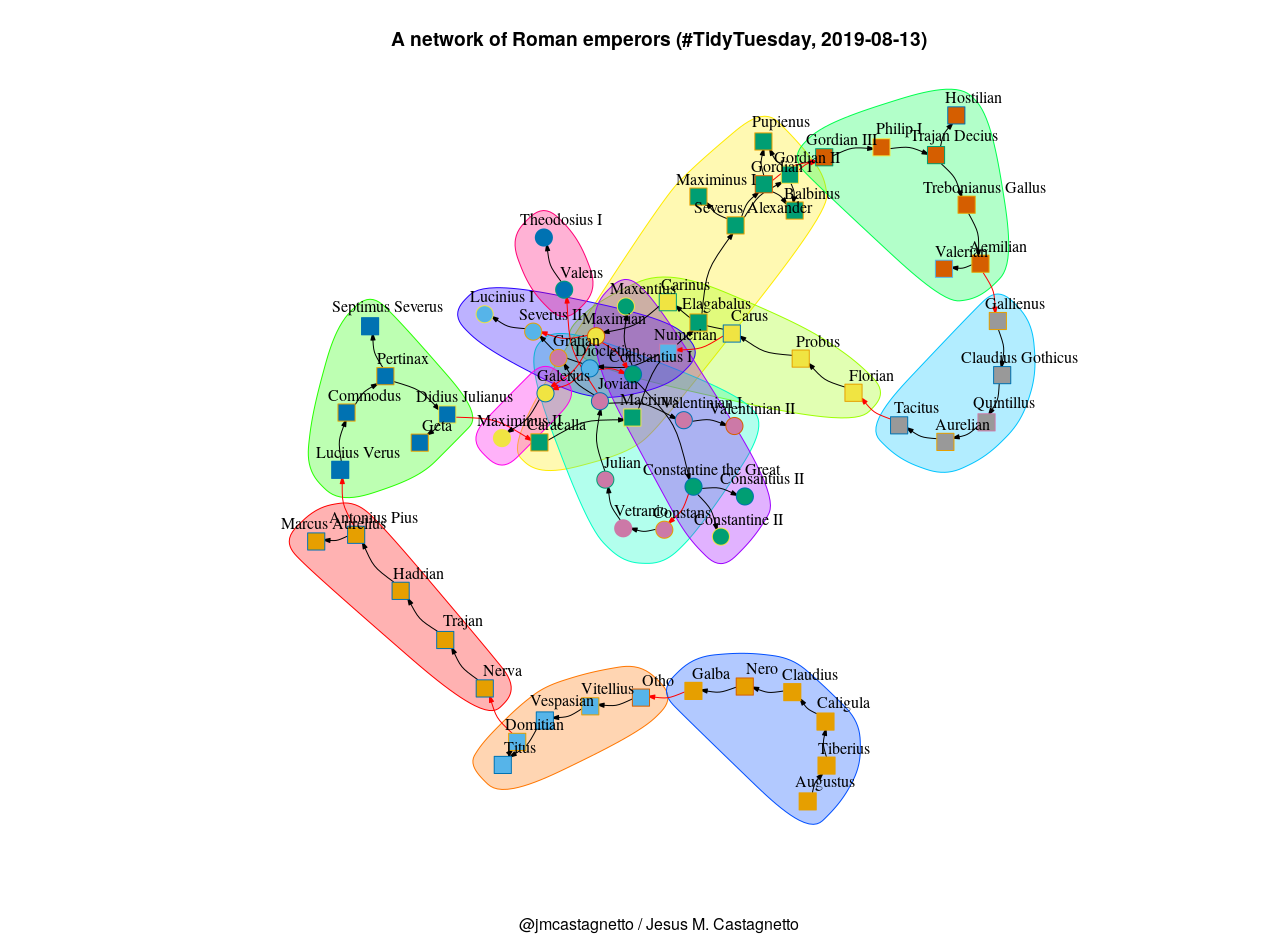
Using igraph
Regular network
And with (artificial) clusters
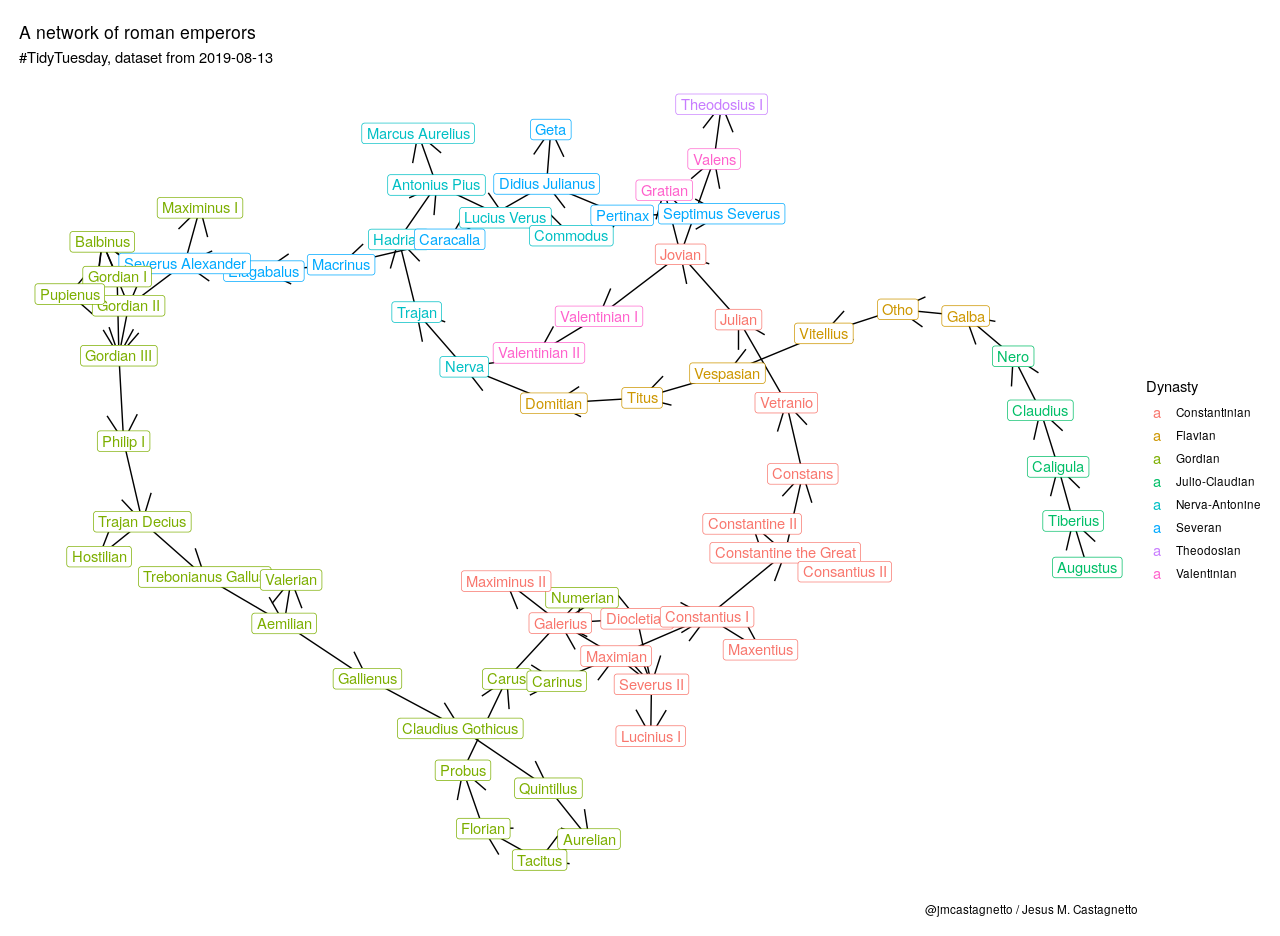
Using ggraph
Categories: tidytuesday - R